UK local elections 2026 — a forecast comparator
A static, interactive site comparing eight published forecasts of the 7 May 2026 UK local-election seat outcomes against the actual result. Four ways to read the same data, transparent dated provenance, recomputes three of the eight from current polling against a 2022 baseline. Live.
Live at uk-elections.jasontc.net; source at jason-chao/uk-elections (open source).
A side-by-side comparator of eight published forecasts of the 7 May 2026 UK local-election seat outcomes, set against the actual results. The same data is shown four ways — each view answers a different question.
At a glance
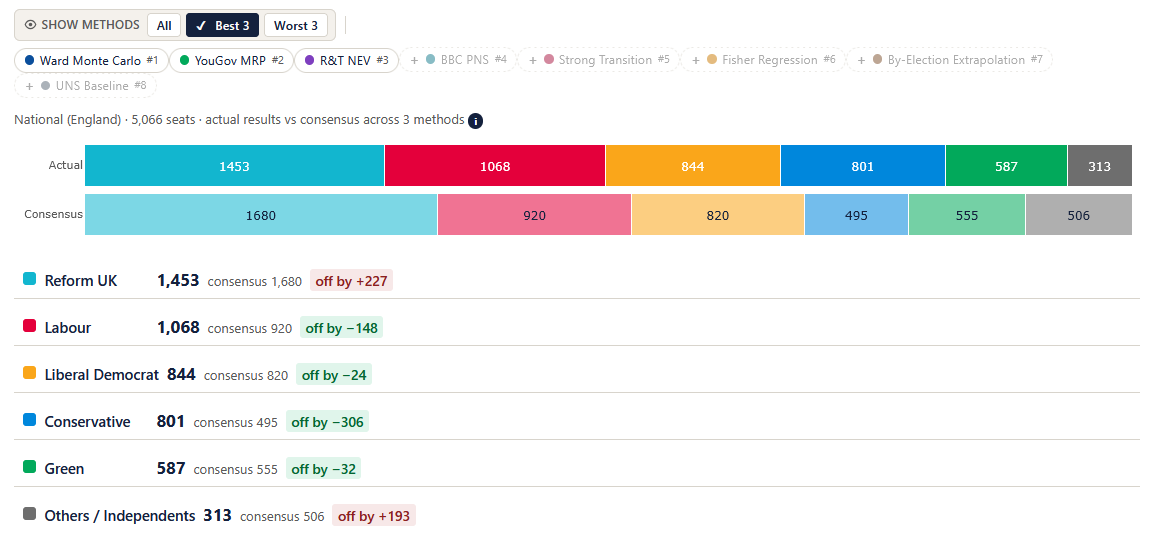
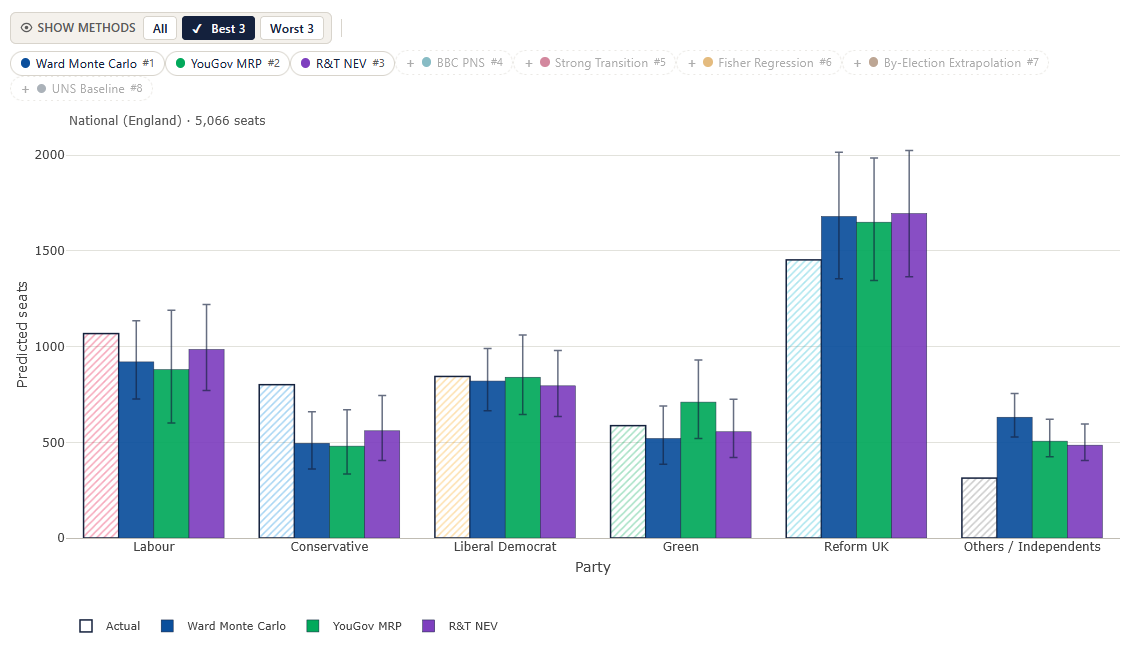
Bars per party
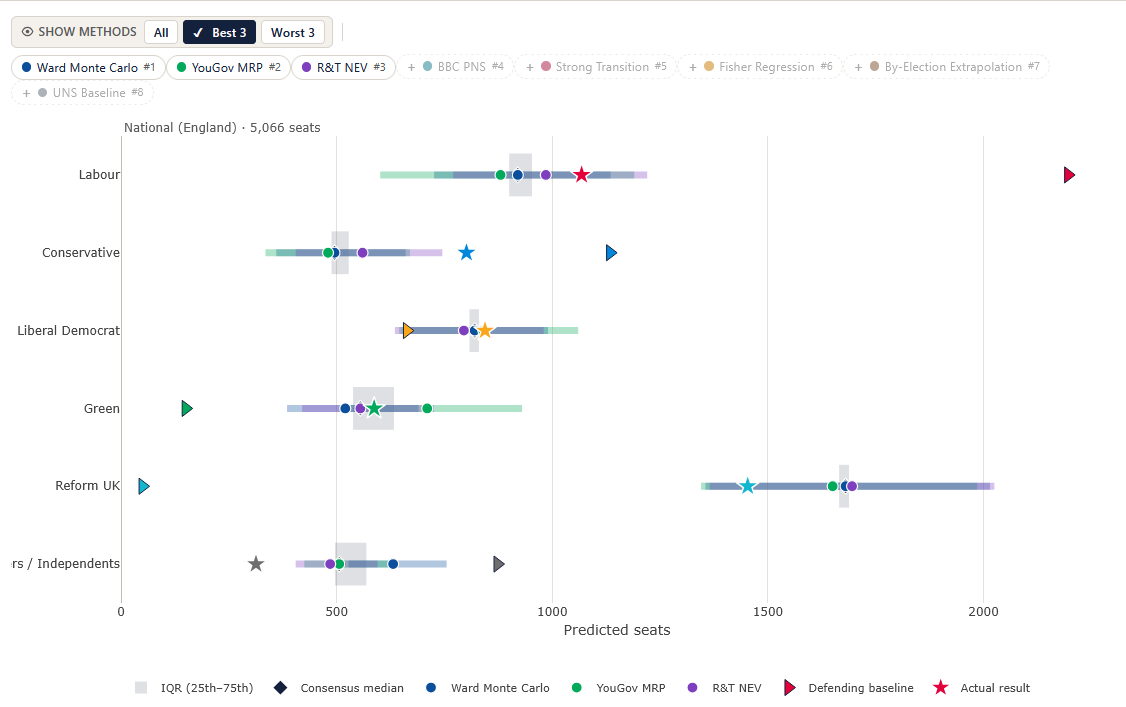
Method spread
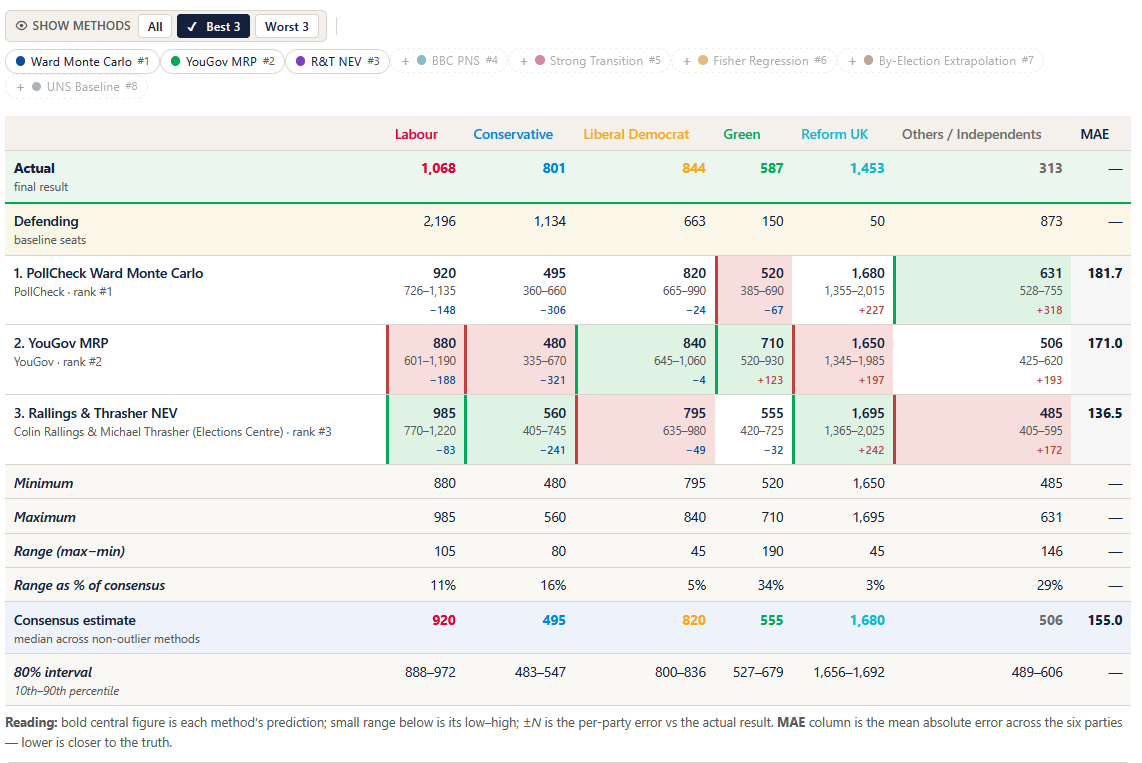
Numbers
The eight methods
- Ward Monte Carlo (PollCheck)
- YouGov MRP
- R&T NEV — Rallings & Thrasher National Equivalent Vote
- BBC PNS — Projected National Share
- Strong Transition (Electoral Calculus)
- Fisher Regression (Elections Etc)
- By-Election Extrapolation (Mark Pack)
- UNS Baseline — Uniform National Swing
Three of the eight — BBC PNS, R&T NEV, and UNS Baseline — are re-computed from current polling against a 2022 baseline rather than re-published from the original forecaster. The other five reflect each forecaster’s own published numbers at build date. The same comparison runs across National plus five English regions.
Track records
The eight methods aren’t equally reliable. A toggle at the top of every view filters between All, Best 3, and Worst 3 — useful both for forming a credible consensus and for sanity-checking what the weaker methods predicted.
Ranking is by historical track record: each method’s past forecasts are compared with the corresponding actual results, and methods are ordered by how well they called previous elections. The Track record tab on the live site shows the per-method history that underwrites the rank — visible to any reader who wants to audit the ordering.
For the 7 May 2026 election, the Best 3 were Ward Monte Carlo (PollCheck), YouGov MRP, and R&T NEV. The consensus across these three is the more informative default; an average across all eight pulls in weaker methods and dilutes signal.
Keeping it current
The interesting engineering choice is the data refresh. An AI-assisted refresh routine pulls the latest forecasts, re-derives the BBC PNS / R&T NEV / UNS Baseline methods from current polling, regenerates the data files, and reports what moved between runs. The difference between “this gets stale in three weeks” and “this stays current with one prompt”.
What it demonstrates
- Election-forecasting methodology literacy across eight named methods, including the difference between re-publishing a forecast and re-computing it from inputs.
- Data visualisation with transparent provenance — every cell traceable to a dated source file in the archive.
- Method ranking grounded in measured past performance, not editorial opinion.